
Variable History
Variable history shows logged values as a table. It looks at the same data as the trend graphic; the difference is that it gives you the numbers rather than the curve.
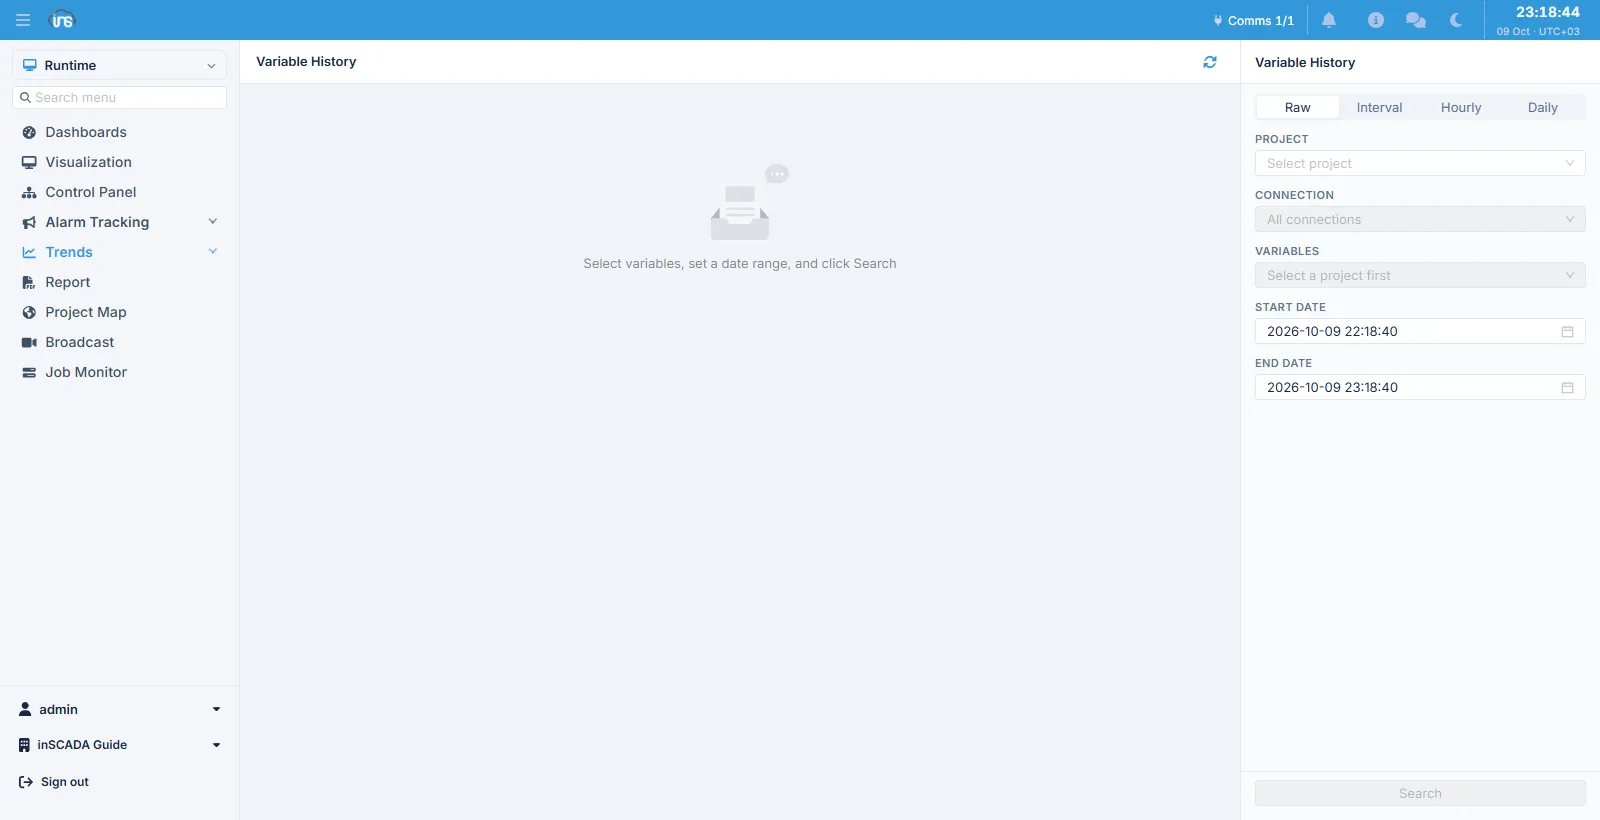
In the right-hand panel you choose the project, optionally a connection, and then the variables; give a start and end date and press Search.
The order matters: the variable list does not fill until a project is chosen, because variables belong to a project. Choosing a connection is an optional narrowing — a way to shorten a long variable list.
Four resolutions
Section titled “Four resolutions”The tabs at the top of the panel decide the resolution the values come back at:
| Tab | What it returns |
|---|---|
| Raw | The logged values themselves, unsummarised |
| Interval | Summarised at an interval you choose |
| Hourly | An hourly summary |
| Daily | A daily summary |
When a table beats a chart
Section titled “When a table beats a chart”A trend graphic shows the shape; this screen gives you the value. When you need the exact second and value at which an alarm fired, a figure for a shift report, or the moment a device stopped sending, the table is the more direct answer.
Related
Section titled “Related”- Trend Graphic — the same data as a chart
- Variables — the logging configuration