
Alarm History
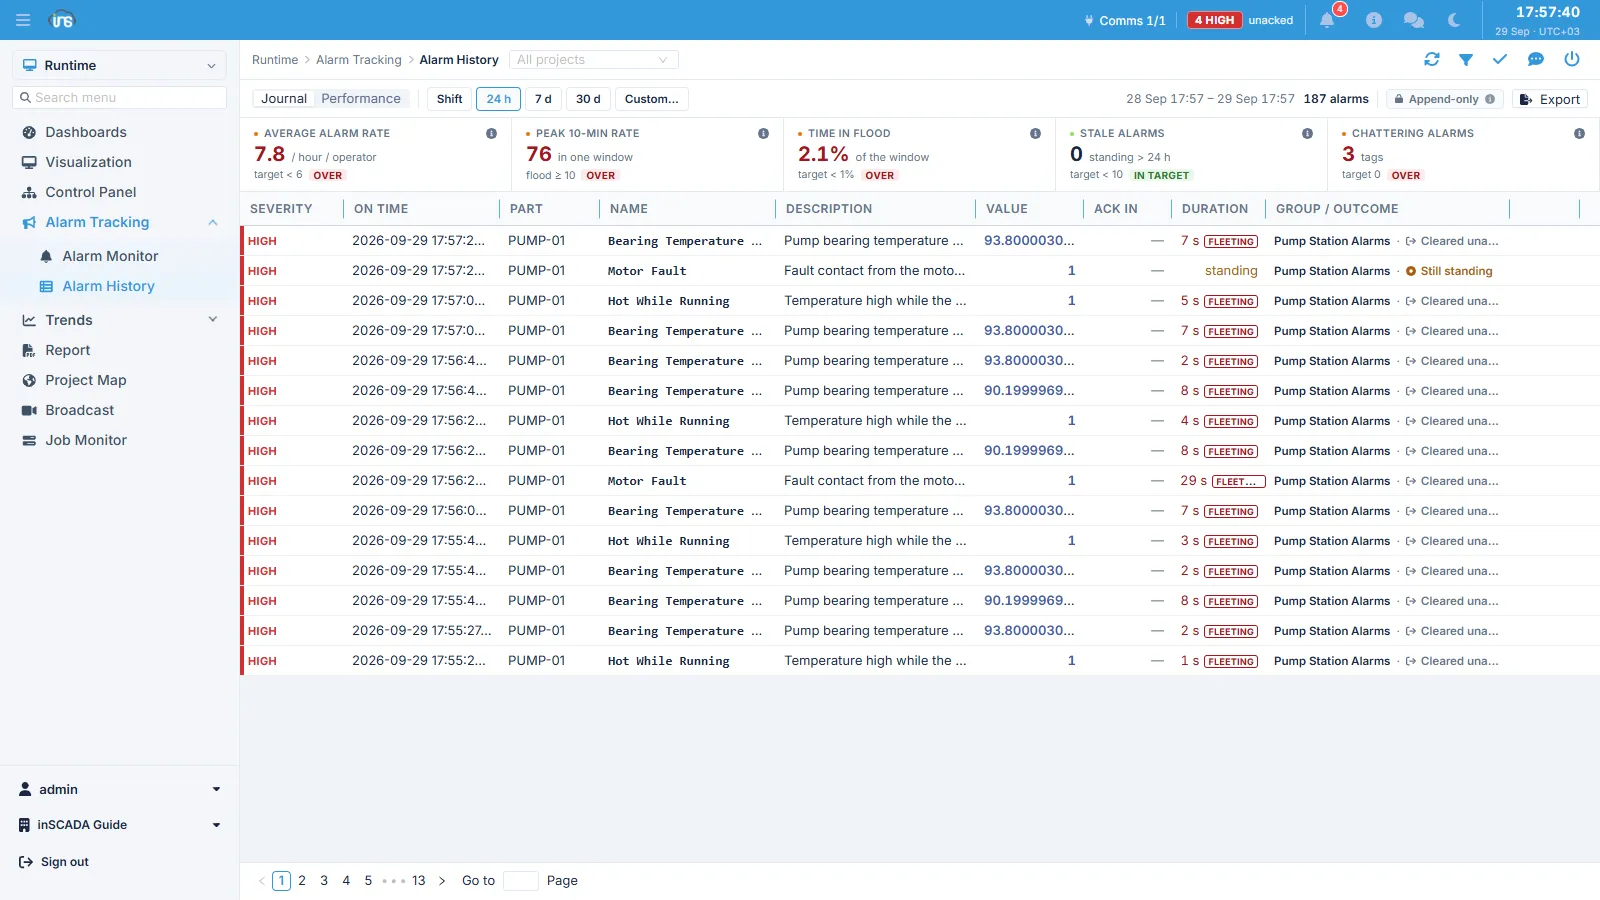
Alarm history lists the records of alarms that have fired within a time window, and computes alarm-management performance indicators for that same window. Where the alarm monitor shows the present, this screen looks back — it is what shift reviews, fault investigations and audits are built from.
Time window
Section titled “Time window”The preset ranges are Shift, 24 h, 7 d and 30 d; Custom takes an arbitrary range. The selected window drives both the list and the indicators above it — changing it recomputes the KPIs.
Performance indicators
Section titled “Performance indicators”The strip along the top computes five indicators for the selected window. Each card also shows its target and whether the window is inside or outside it.
| Indicator | What it measures | Target |
|---|---|---|
| Average Alarm Rate | Alarms per hour per operator | Low enough for an operator to follow |
| Peak 10-Min Rate | Alarms in the busiest ten-minute window | Above a set count this counts as a flood |
| Time in Flood | What share of the window was spent in flood | As close to zero as possible |
| Stale Alarms | Alarms that have stayed on for more than 24 hours | Near zero |
| Chattering Alarms | Tags that fire repeatedly in quick succession | Zero |
These follow the same reasoning as the ISA-18.2 / IEC 62682 alarm-management measures and are a read on the health of the alarm system. A high average rate or a long time in flood means the operator is being given more than they can watch.
Chattering and stale point straight at configuration: a chattering tag usually means a missing deadband or delay (Analog Alarms), while an alarm standing for days is either a problem nobody resolved or a condition written so that it can never clear.
Individual records are flagged too — a short-lived one is marked fleeting.
Record Fields
Section titled “Record Fields”Every alarm that fires produces a record. The record keeps the state of that moment, independently of the alarm definition.
| Field | Description |
|---|---|
| alarmName | Which alarm fired |
| onTime | When it fired |
| offTime | When it cleared — empty means it is still ON |
| status | On / Off |
| acknowledgedBy / acknowledgeTime | Who acknowledged it, and when |
| comment / commentedBy / commentTime | The comment and who added it |
| variableValue | The variable’s value at the moment it fired |
| part | Equipment / line code, inherited from the alarm definition |
variableValue records the value the alarm fired at. Looked at later, it shows how far past the threshold things went — which is what separates an event that touched the limit and returned from a serious excursion.
part is copied from the alarm definition and is what makes per-equipment filtering possible. If it was left empty on the definition it stays empty in the history too, so it has to be filled in at definition time if reporting by equipment is planned.
The outcome column
Section titled “The outcome column”Group / Outcome names the alarm group the record belongs to and says how the record ended — an alarm that cleared without being acknowledged, for instance, is distinguished here. Events that came and went unseen therefore do not disappear into the list.
Export
Section titled “Export”The list can be exported for the selected window. Records are append-only: past records are not altered, which is what keeps the audit trail intact.
Querying from a script
Section titled “Querying from a script”Alarm history can also be queried from a script — by date range, with paging, and with a choice of whether cleared alarms are included. Method inventory and examples: Alarm API →
Related
Section titled “Related”- Alarm Monitor — current state and operator actions
- Alarm Management — how alarm definitions are structured