
Control Panel
The control panel shows what a project is doing while it runs, on one screen, and lets you stop and start it from there. It is the first place to look when something is wrong.
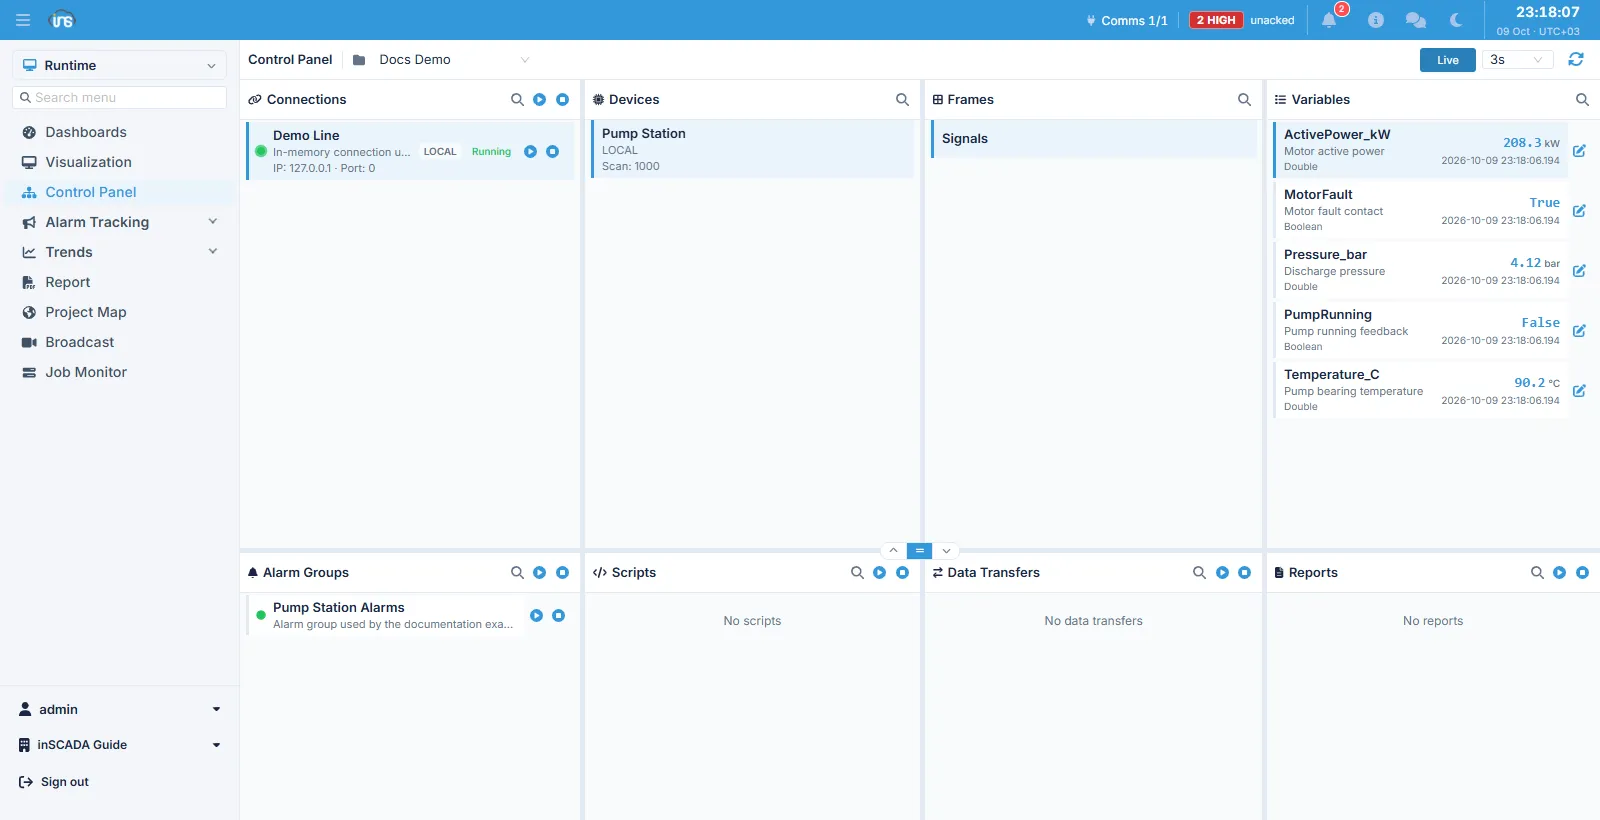
The dropdown at the top picks the project. Top right are a Live toggle and a refresh interval (3s, for instance): in live mode the screen refreshes itself at that rate.
Eight panels
Section titled “Eight panels”The screen is divided into eight panels. The top row is the data path, the bottom row the project’s automation.
| Panel | What it shows |
|---|---|
| Connections | Protocol connections: state, address, port |
| Devices | The selected connection’s devices and their scan time |
| Frames | The selected device’s data blocks |
| Variables | The selected block’s live values |
| Alarm Groups | Alarm groups and whether they are active |
| Scripts | Scripts and their run state |
| Data Transfers | Data transfers |
| Reports | Reports |
The top row works as a chain: select a connection to see its devices, a device to see its frames, a frame to see its variables.
Live values
Section titled “Live values”In the Variables panel each variable shows its name, description, data type, current value with its unit, and the value’s timestamp. The timestamp says when the value was read — not when the screen last refreshed. A frozen value is recognised by its timestamp.
The pencil at the right of a row writes a value. That is a control command and requires the SET_VARIABLE_VALUE permission.
Start and stop
Section titled “Start and stop”The play and stop buttons in a panel’s header start and stop that kind of work in bulk; the buttons beside an individual row affect only that record.
Stopping a connection cuts the data coming from the devices beneath it — the variables hold their last values and their timestamps stop advancing.
Related
Section titled “Related”- Variables — defining a variable and its logging
- Alarm Monitor — fired alarms
- Job Monitor — scheduled work