
Trend Graphic
The trend graphic charts the variables of a defined trend. It has three modes, and which one you pick decides what settings appear in the panel on the right.
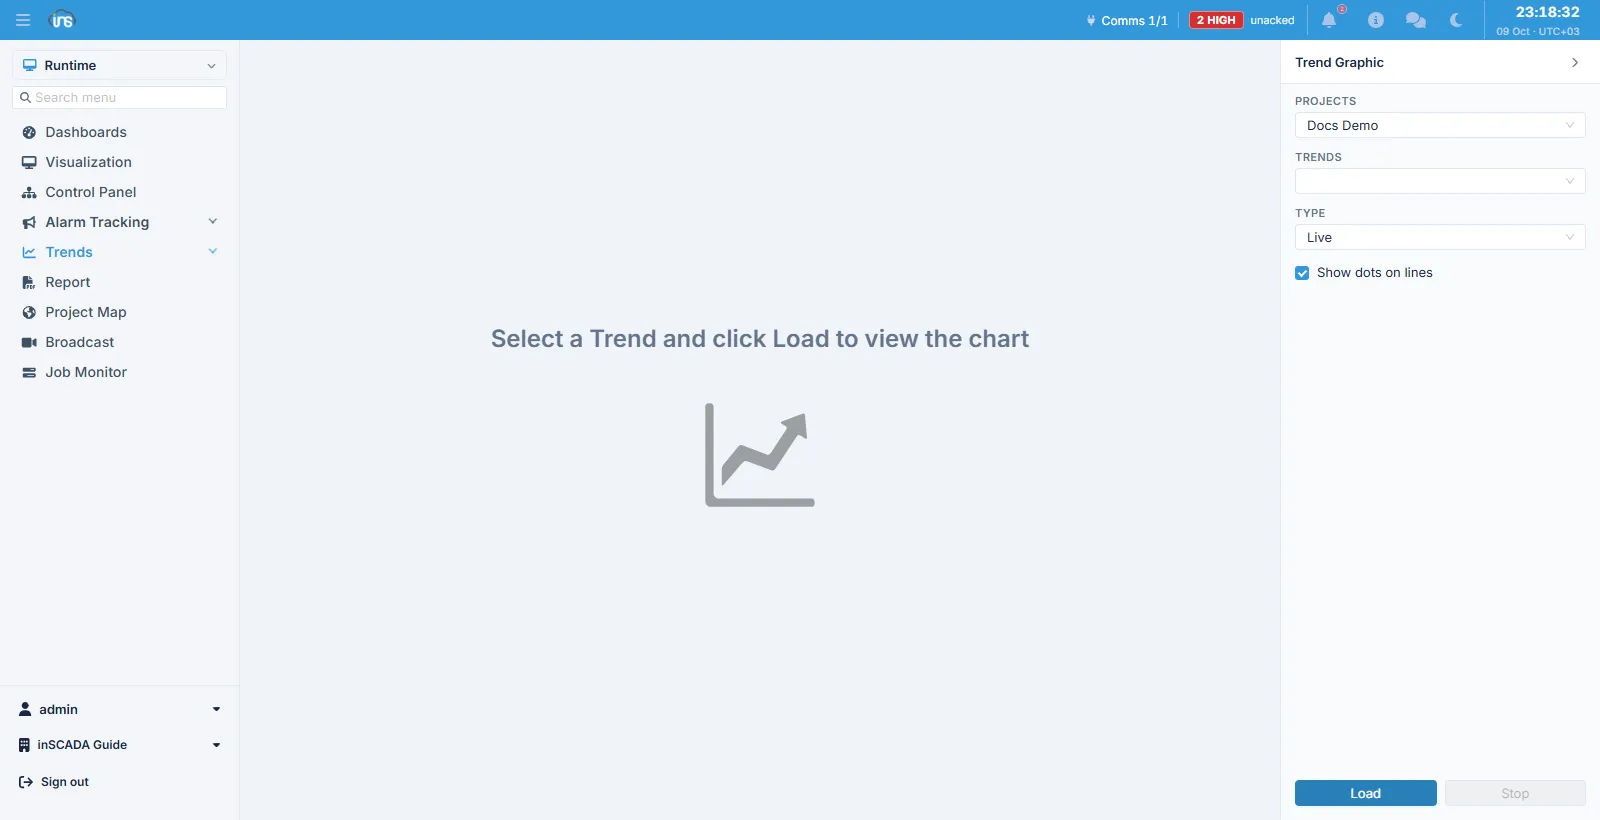
In the right-hand panel you choose the project, then the trend; Load fetches the chart and Stop halts a live feed.
Three modes
Section titled “Three modes”| Type | What it does |
|---|---|
| Live | Draws values as they arrive; the chart scrolls as it goes |
| Interval | Summarises a date range at a chosen sampling interval |
| Limit | Pages through the records themselves |
Live mode asks for no date range — it keeps drawing arriving values for as long as the screen is open. Stop halts the feed.
Interval
Section titled “Interval”Interval mode asks for a start and an end date and summarises what lies between them by dividing it into sampling intervals. Which value is drawn for each interval is decided by the calculation type:
| Calculation type | What it returns |
|---|---|
| Min / Max | The interval’s lowest / highest value |
| Avg | The mean |
| Sum | The total |
| Count | How many records |
| First Value / Last Value | The interval’s first / last value |
| Max Difference | The largest difference within the interval |
| Last First Difference | The last value minus the first |
| Middle Value | The middle value |
The sampling interval can be left automatic, in which case it is worked out from the date range you chose. Giving a value by hand turns the automatic calculation off.
Paged mode is for walking the records themselves rather than summarising them: you give a page size and page back and forth. Use it when you need to look at the raw records.
Presets
Section titled “Presets”The screen offers a list of keywords. Picking a preset sets the date range, the sampling interval and the calculation type in one go, rather than entering them each time. Presets are defined on the Keywords screen.
Other controls
Section titled “Other controls”Show dots on lines marks the data points on the lines, which helps show where the data actually is in a sparsely sampled series.
The chart can be exported to Excel.
Related
Section titled “Related”- Variable History — the same values as a table
- Trends — defining a trend
- Keywords — presets