
Job Monitor
The job monitor shows how often a project’s scheduled work runs, how long it takes and how much of it fails. It is where you first see something slowing down or failing quietly.
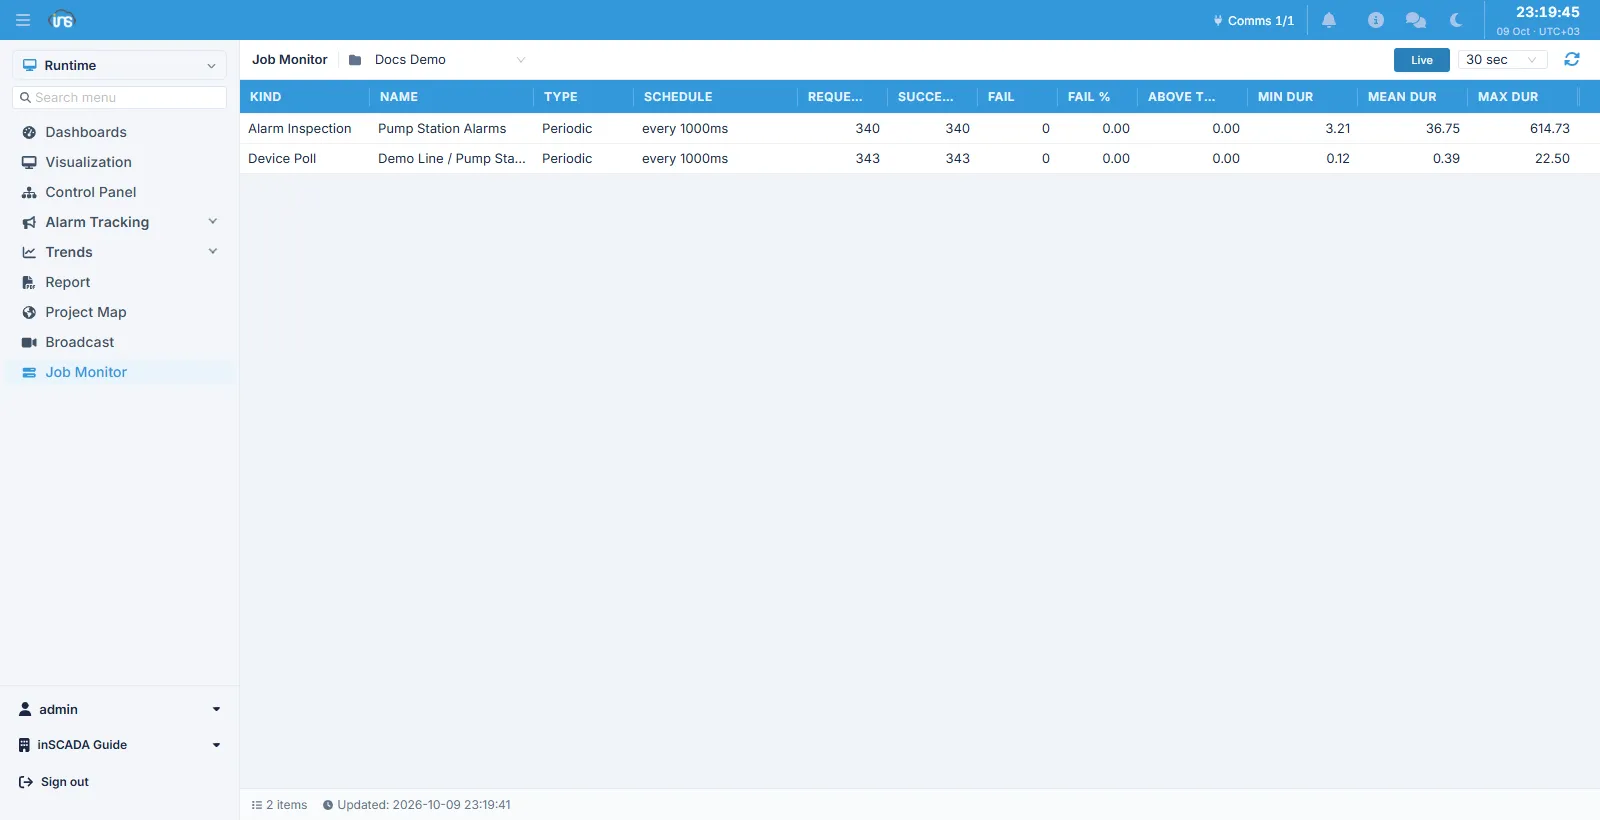
The project is picked at the top; top right are a Live toggle and a refresh interval. The footer says how many jobs are listed and when the data was last refreshed.
Columns
Section titled “Columns”| Column | Description |
|---|---|
| Kind | The kind of job |
| Name | The name of the record the job belongs to |
| Type | The scheduling form (Periodic, for instance) |
| Schedule | The schedule (every 1000ms, for instance) |
| Requested | How many runs were asked for |
| Succeeded | How many succeeded |
| Fail | How many failed |
| Fail % | The failure percentage |
| Above T. | The percentage of runs whose duration exceeded the threshold |
| Min / Mean / Max Dur | Duration statistics, in milliseconds |
The kinds of job
Section titled “The kinds of job”The platform schedules these itself:
| Kind | What it does |
|---|---|
| Device Poll | Scans a device |
| Connection Health | Checks a connection’s health |
| Alarm Inspection | Evaluates an alarm group |
| Script | Runs a scheduled script |
| Report Print / Report Mail | Produces / mails a report |
| Data Transfer | Carries out a data transfer |
| Variable Pulse On / Off | Turns a pulse output on / off |
Reading the numbers
Section titled “Reading the numbers”The duration statistics cover the last 1000 runs — not everything since the installation started. That is why an average recovers by itself once a problem is fixed.
The most telling reading is Mean Dur against Schedule. When the mean approaches the interval, the job is barely finishing before its next run is due; when Max Dur exceeds the interval, some runs were already late.
Above T. answers the same question directly: what percentage of runs came in over the threshold.
Related
Section titled “Related”- Control Panel — starting and stopping work
- Log — the reason behind a failure