
Pivot Report
A pivot report is one you build by configuring the table rather than drawing it: which variables, under which headings, with which calculation. When you would rather write the page yourself, the other family is the HTML Report.
Four levels
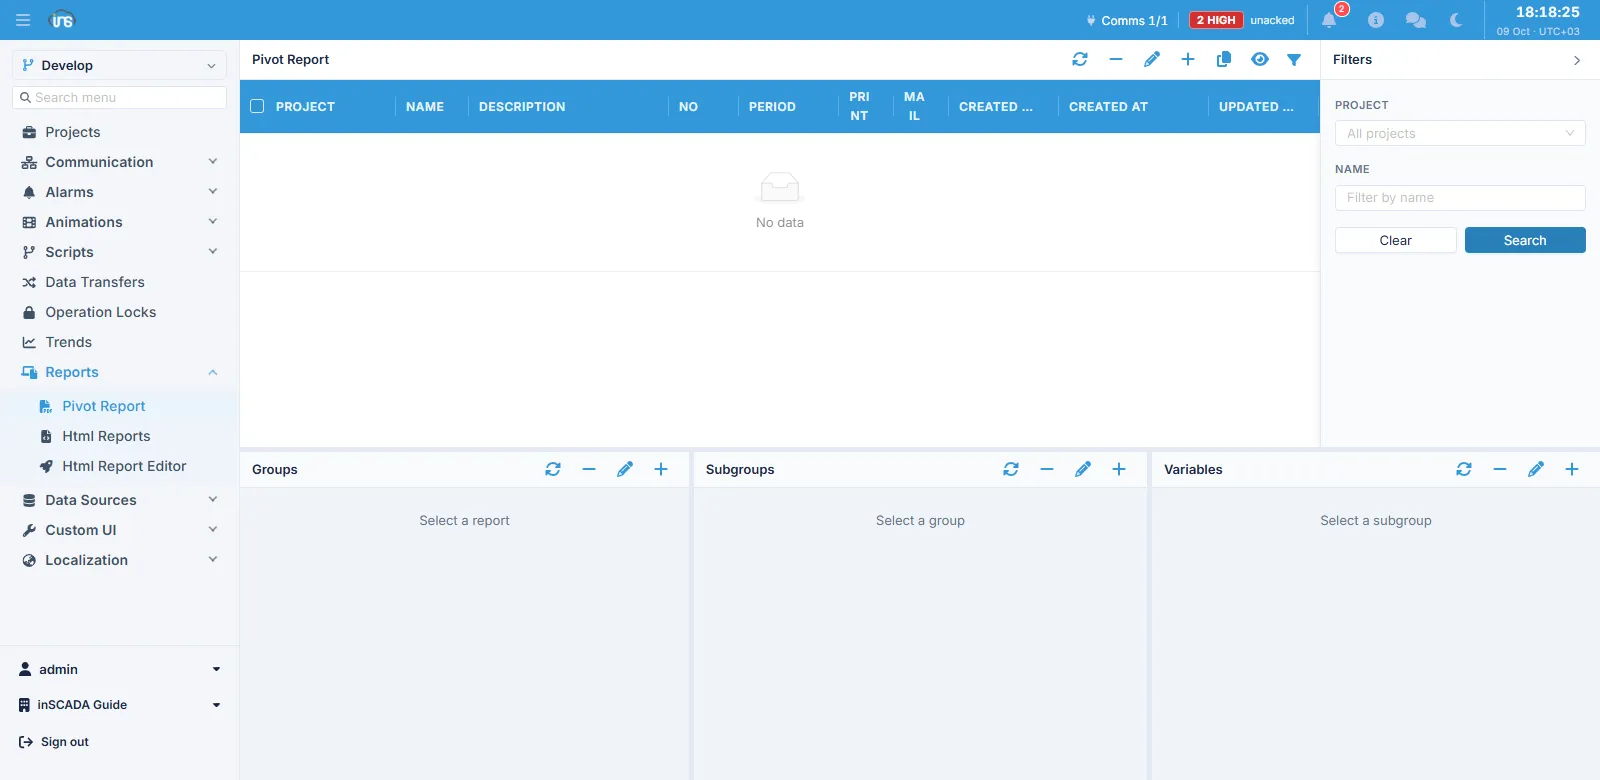
Section titled “Four levels”The three panels across the lower half of the screen are not incidental; they are the report’s structure:
Select a report and you see its groups, select a group and you see its subgroups, select a subgroup and you see its variables. Every level carries an order field, and that is what sets the layout of the output.
The report’s fields
Section titled “The report’s fields”| Field | Description |
|---|---|
| Name | The report’s name, up to 100 characters |
| Description | Description |
| No | A report number or code |
| Period | The slice the report covers — see below |
| Report time | The time the report is produced. Required for every period |
| Language | The language of the report’s headings and its total and deviation labels |
| Logo | Whether the company logo is printed on the output |
Period
Section titled “Period”| Period | What it needs |
|---|---|
| Hourly | The time alone |
| Monthly | A day of the month (1–31) |
| Minutes | A length in minutes (1–1439) |
Calculation types
Section titled “Calculation types”Each variable cell applies a calculation to the data gathered across the slice:
| Min · Max · Avg | Lowest, highest, average |
| Sum · Count | Total, number of samples |
| First Value · Last Value | The slice’s first and last reading |
| Max Difference | The largest difference within the slice |
| Last First Difference | Last minus first — on a meter, this is consumption |
| Middle Value · Median Value | The middle and the median reading |
A cell can also take a format pattern (0.00, say), a total column computed from a second variable, and a deviation column measured against another cell.
Scheduling, printing and mail
Section titled “Scheduling, printing and mail”The report has its own schedule, and separate day and time fields for printing and for mail, each of which can be turned on independently.
With mail on, the recipients come from the report’s own Mail To field. That holds when sending from a script too: the call takes no recipient list and uses the one on the report’s definition.
Output formats
Section titled “Output formats”A report produces HTML and PDF; the PDF is printed by a headless browser on the server. There is no Excel output — use the export paths to get table data into Excel.
A report run by hand is distinguishable from a scheduled one in the output: the document’s heading reads Manual in one case and Automatic in the other.
Related
Section titled “Related”- HTML Report — the other family, where you write the page
- Script Engine — producing and sending a report from a script