
Trends
A trend is a set of variables brought together to be watched as one. Gather a pump’s temperature, pressure and current into a single trend and the operator sees all three on one chart, on the same time axis.
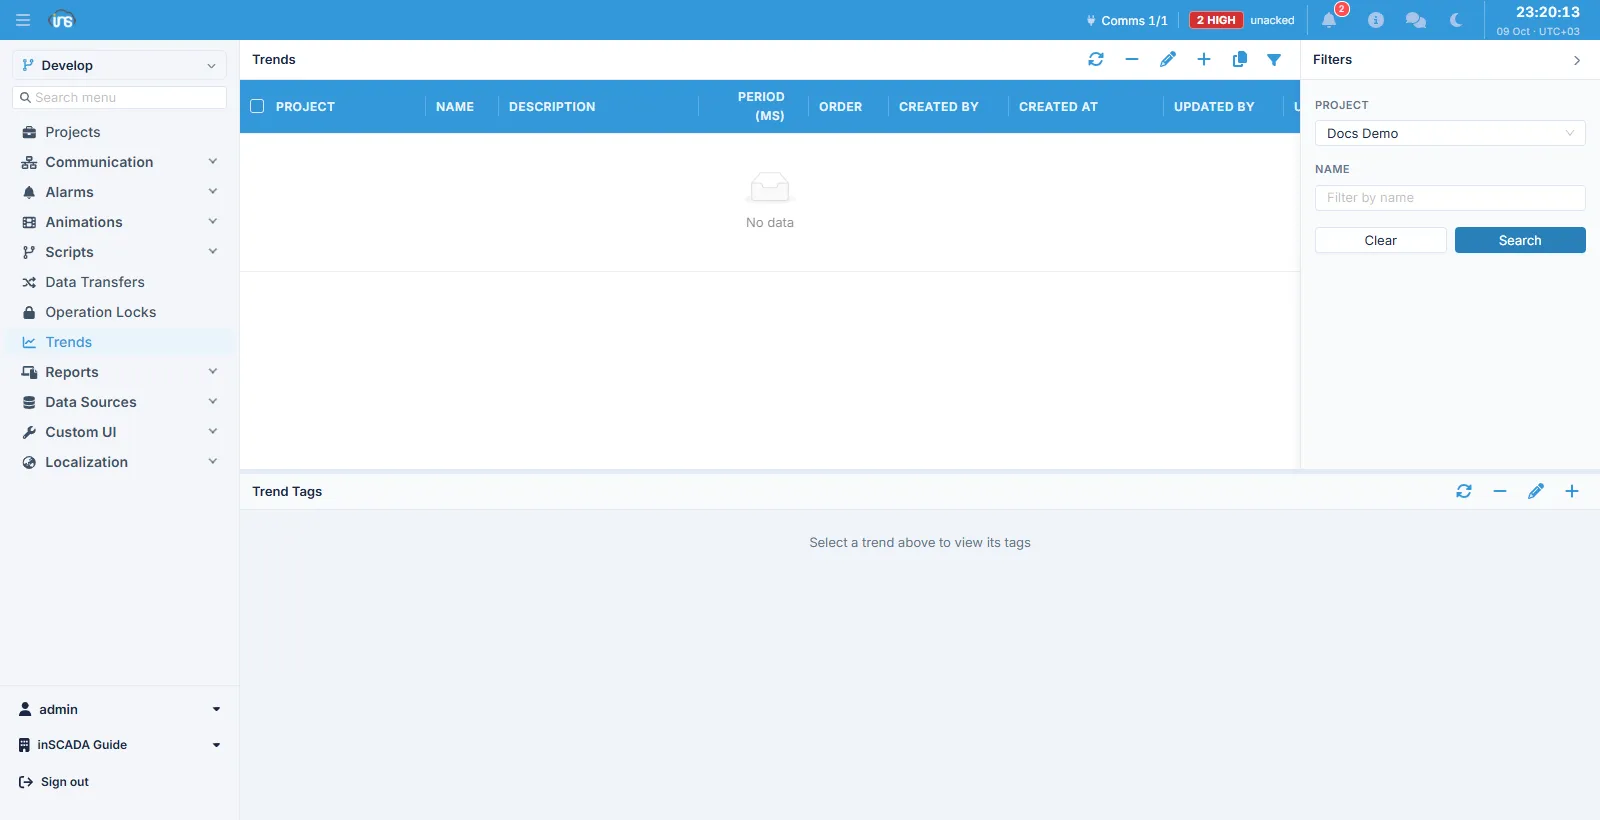
The screen is in two parts: the list of trends above, and the selected trend’s Trend Tags panel below.
Trend fields
Section titled “Trend fields”| Field | Description |
|---|---|
| Name | The trend’s name, max 100 characters |
| Description | Description, max 255 characters |
| Period (ms) | The sampling period, in milliseconds |
| Order | Where it appears in lists |
A trend is made of the tags added in the Trend Tags panel. Each tag carries a variable and how that variable is drawn on the chart:
| Field | Description |
|---|---|
| Name | The tag’s name |
| Description | Description |
| Variable | The variable to draw |
| Status | Whether the tag is active |
| Min Scale / Max Scale | The axis floor and ceiling |
| Color | The line colour |
| Thickness | The line thickness |
| Grid Thickness | The grid thickness |
| Hide Value Axe | Hide this tag’s value axis |
| Order | Drawing and listing order |
Related
Section titled “Related”- Trend Graphic — where a trend is drawn
- Variable History — the same data as a table
- Variables — the logging configuration