
SQL Database
This screen is for looking inside a defined datasource and trying a query out. You run it here, see the result, and then keep it as a SQL Query.
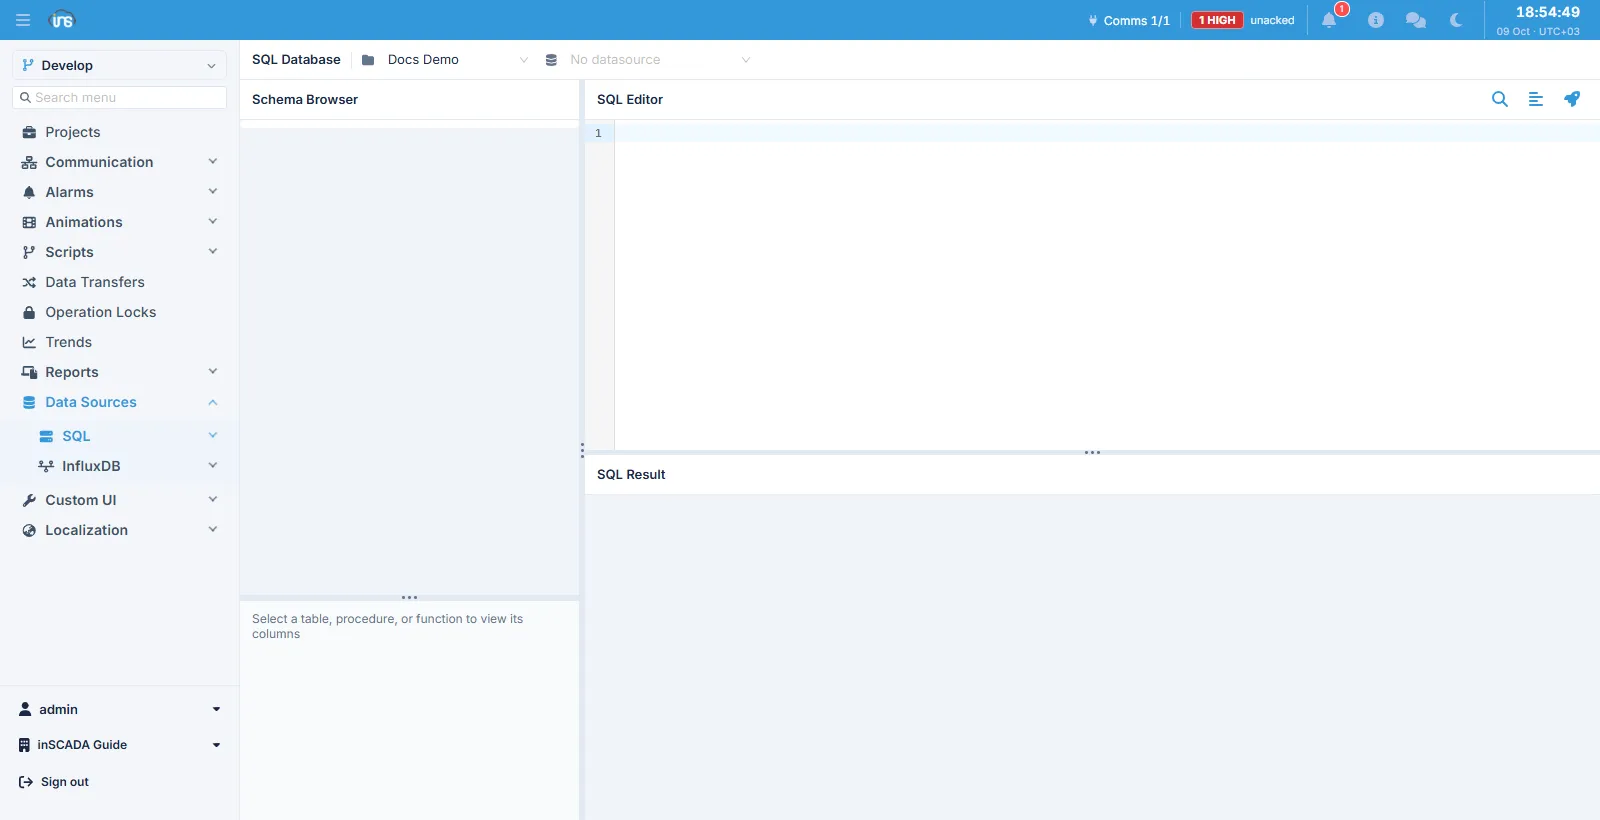
Two selectors sit at the top: first the project, then a datasource within it. The screen is in three parts: the schema browser on the left, the SQL editor at the top right, and the result below it.
The schema browser
Section titled “The schema browser”The tree starts with the datasource’s schemas. Opening one gives three folders, each with a count beside it:
- Tables
- Procedures
- Functions
Selecting a table lists its columns in the panel below; selecting a procedure or a function lists its parameters.
Quick queries
Section titled “Quick queries”Right-clicking a table in the tree offers ready-made queries:
| Command | What it does |
|---|---|
| First 10 / 100 / 1000 rows | Fetches the first rows from the table |
| Count rows | Gives the row count |
| Open in editor | Writes the query into the editor without running it |
These are generated for the dialect the datasource’s JDBC address implies: how a name is quoted and how rows are limited differ by database. MySQL/MariaDB, SQL Server and Oracle are each recognised; everything else (PostgreSQL, H2, SQLite, TimescaleDB and the like) uses the standard form.
Editor and result
Section titled “Editor and result”A query written in the editor runs against the selected datasource, and the result appears as a table in the panel below. The splitters between the parts can be dragged.
Running it here is not a rehearsal: the query really executes on that database. Keep that in mind while writing against a datasource pointed at production.
Seeing the schema tree requires the VIEW_DB_METADATA permission and running a query requires RUN_QUERY. They are separate, so a user can be allowed to browse the schema without being allowed to run anything.
Related
Section titled “Related”- SQL Datasource — the connection definition and its timeouts
- SQL Query — saving a query
- InfluxDB Query — the editor on the time-series side