
Project Map
The project map shows projects at their geographic locations. On an installation with several sites — water reservoirs, substations, wind turbines — it is how you see at a glance what is happening where.
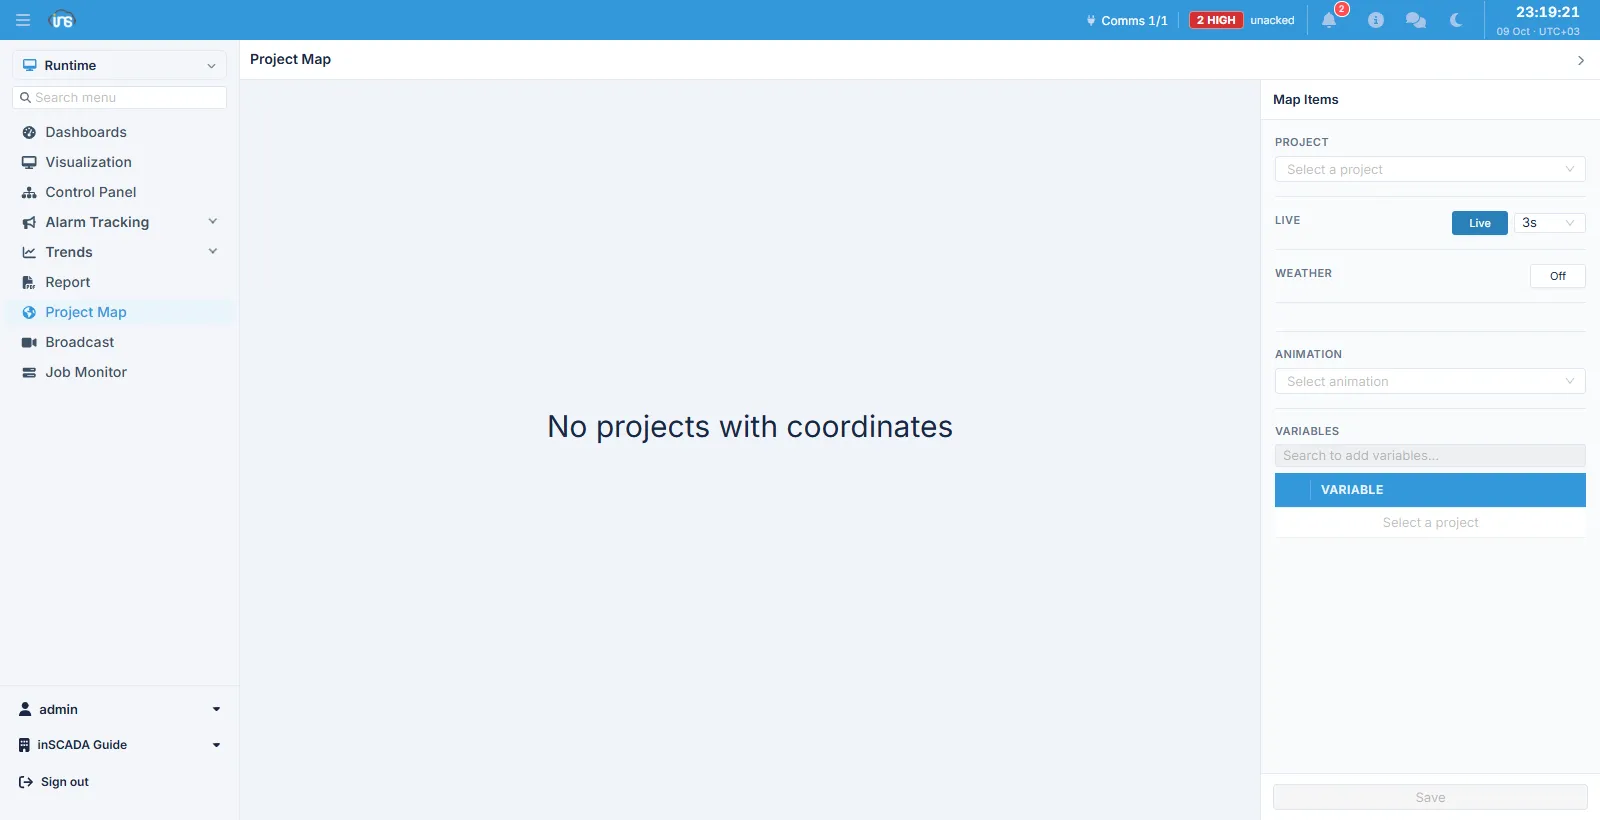
Coordinates first
Section titled “Coordinates first”The map draws the projects that have coordinates defined. With none defined anywhere, the screen says “No projects with coordinates” and stays empty — that is a missing setting, not a fault. The coordinates are on the project’s own definition.
The right-hand panel
Section titled “The right-hand panel”Having picked a project, you set what its marker shows:
| Field | Description |
|---|---|
| Project | The project to configure on the map |
| Live | Live mode and the refresh interval (3s, for instance) |
| Weather | On or off, to show the location’s weather |
| Animation | The animation to open when the marker is clicked |
| Variables | The variables shown on the marker |
Save keeps the choice, so the map comes back the same way next time.
Weather
Section titled “Weather”The weather layer comes from an external service and uses the API key on the Map Settings screen. Without a key the layer does not arrive.
Related
Section titled “Related”- Map Settings — the API keys
- Visualization — the screens a marker opens