
Platform Architecture
inSCADA is a SCADA platform designed to collect, process, visualize, and automate data from field devices. It runs as a single application — all components live in one process.
Data Hierarchy
Section titled “Data Hierarchy”All data in inSCADA is organized at two levels: Space and Project. Some components are shared across all projects in a space; others belong to a single project.
A space is the top-level isolation unit. Each space has its own projects, users, and configuration. Different spaces are fully independent of one another.
Typical uses:
- Customer isolation — one space per customer
- Environment separation — dev, test, production
- Departmental split — energy, water, building automation
Project
Section titled “Project”A project represents a facility, site, or logical unit. A space can contain many projects. Every component of a project (connections, alarms, scripts, screens, etc.) runs within the project’s scope.
Example projects:
- “Ankara Factory” — a production plant
- “GES-01” — a solar power plant
- “Building-A HVAC” — the HVAC system of a building
Projects can carry optional latitude/longitude coordinates and be shown on the map view.
Connection
Section titled “Connection”A connection is a communication channel to a field device or system. Each connection uses one protocol.
Supported protocols:
| Group | Protocol | Client | Server / Slave |
|---|---|---|---|
| Industrial | Modbus TCP / UDP / RTU over TCP | ✓ | ✓ (per transport) |
| S7, S7-Plus | ✓ | — | |
| EtherNet/IP | ✓ | — | |
| Mitsubishi MC TCP / UDP | ✓ | — | |
| Beckhoff ADS | ✓ | — | |
| Fatek TCP / UDP | ✓ | — | |
| Power / utility | DNP3 | ✓ | ✓ |
| IEC 60870-5-104 | ✓ | ✓ | |
| IEC 61850 | ✓ | ✓ | |
| Building automation | BACnet | ✓ | ✓ |
| KNX | ✓ | — | |
| Open standard | OPC UA | ✓ | ✓ |
| OPC DA | ✓ | — | |
| OPC XML | ✓ | — | |
| MQTT | ✓ | — | |
| SNMP | ✓ | — | |
| Internal | LOCAL (simulation / internal computation) | — | — |
Every connection can be started and stopped independently. Status values: Connected, Disconnected.
Device
Section titled “Device”A device represents a physical or logical unit over a connection. A Modbus TCP connection, for example, may address several slave devices.
A frame is a block of data read from a device. Each frame defines an address range and a read period.
| Parameter | Description |
|---|---|
| Start address | First address to read |
| Quantity | Number of registers / points to read |
| Period | Read interval (ms) |
Variable
Section titled “Variable”The variable is the core data unit on the platform. A temperature reading, a motor status, a meter value — each one is a variable.
Core fields:
| Field | Description |
|---|---|
| Name | Unique within the project |
| Type | Float, Integer, Boolean, String |
| Unit | Engineering unit (°C, kW, bar, V, A, …) |
| Scaling | Raw → engineering conversion (engZeroScale, engFullScale) |
| Logging | Historical logging mode |
| Expression | Optional computed-value formula |
Scaling
Section titled “Scaling”Raw value is linearly converted to engineering value:
Engineering = engZeroScale + (raw - rawZeroScale) × (engFullScale - engZeroScale) / (rawFullScale - rawZeroScale)Example: 4-20 mA sensor → 0-100 °C:
- Raw: 4 mA → 0 °C, 20 mA → 100 °C
- engZeroScale=0, engFullScale=100, rawZeroScale=4, rawFullScale=20
Logging Types
Section titled “Logging Types”| Type | Description |
|---|---|
| No Log | Not logged |
| When Changed | Log on value change |
| Periodically | Log at fixed interval (logPeriod seconds) |
| Threshold | Log when a threshold is crossed |
| Expression | Log decision driven by a user expression |
| Custom | Script-driven custom logic |
Value Expression
Section titled “Value Expression”A variable can carry a per-variable compute formula. On every read cycle the formula runs and its result becomes the variable value:
// Sine-wave simulationvar t = new Date().getTime() / 1000;return (Math.sin(t / 60) * 150 + 450).toFixed(2) * 1;Alarm System
Section titled “Alarm System”Alarm Group
Section titled “Alarm Group”Alarms are organized into groups. Every alarm group belongs to a project and can be enabled/disabled together.
Alarm Types
Section titled “Alarm Types”| Type | Description | Parameters |
|---|---|---|
| Analog | Numeric threshold | setPoint, highHigh, high, low, lowLow |
| Digital | Boolean state | ON → alarm, OFF → normal |
| Custom | Script-based condition | JavaScript expression |
Alarm Status (FiredAlarm)
Section titled “Alarm Status (FiredAlarm)”Each triggered alarm is stored as a FiredAlarm record. The actual status is two-valued:
ON (fired) → OFF (cleared)Acknowledge and comment are not part of the status — acknowledgeTime, acknowledgedBy, commentTime, comment are separate fields that capture user interaction but do not change the alarm state.
Every alarm event is stored historically: fire time, clear time, who acknowledged, duration.
Script Engine
Section titled “Script Engine”Scripts are the platform’s automation engine. They run server-side on GraalJS (Nashorn compatibility mode) and access all platform data through the ins.* API.
Typical Script Use Cases
Section titled “Typical Script Use Cases”| Area | Description | Example |
|---|---|---|
| Scheduled task | Periodic or timed execution | Energy calc every 10 s |
| Variable formula | Value derivation | Derive a 3rd variable from two others |
| Alarm condition | Custom alarm logic | Condition across multiple variables |
| Data integration | REST calls | Pulling weather data from an API |
| Reporting | Automatic reports | Emailing a daily PDF report |
| Notification | Event-driven messaging | Sending an SMS on alarm fire |
Schedule Types
Section titled “Schedule Types”| Type | Behavior |
|---|---|
| Periodic | Runs every X milliseconds |
| Daily | Runs once a day at a fixed time |
| Once | Runs once and stops |
| None | Manual / API trigger only |
Details: Script Engine →
Visualization Components
Section titled “Visualization Components”Animation (SVG screen) — Project-level
Section titled “Animation (SVG screen) — Project-level”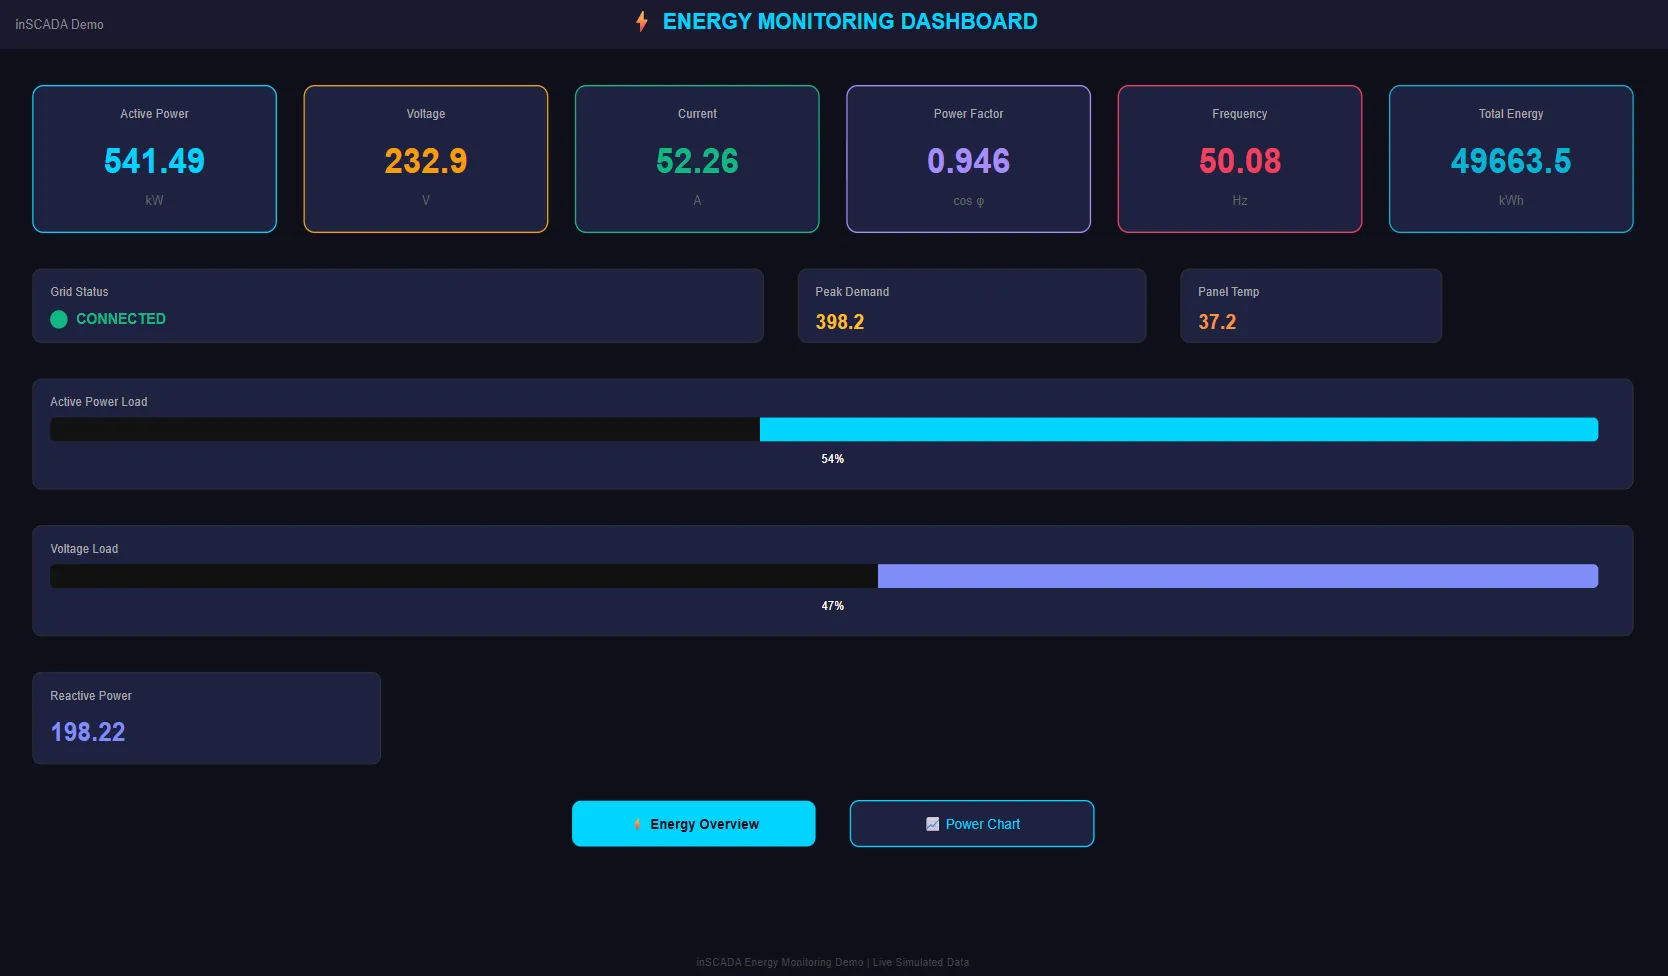
SVG-based interactive SCADA screens. Variable values are rendered live: color changes, movement, numeric readouts, on/off controls.
Faceplate — Project-level
Section titled “Faceplate — Project-level”Reusable SVG components. A motor, valve, or pump that appears many times can be defined once as a faceplate and embedded in multiple animations.
Symbol (SVG symbol library) — Space-level
Section titled “Symbol (SVG symbol library) — Space-level”An SVG symbol library shared across the space. Animations and faceplates in any project can reference its symbols.
Dashboard — Space-level
Section titled “Dashboard — Space-level”Used to combine data from several projects into a single board. Defined at the space level so it can span projects.
Trend Chart — Project-level
Section titled “Trend Chart — Project-level”Time-series charts of one or more variables (Trend Tag). Used for historical inspection and comparison.
Custom Menu — Space-level
Section titled “Custom Menu — Space-level”Builds a per-role navigation menu. Different menus can be assigned to different roles: operator sees only monitoring screens, manager sees reports, engineer sees configuration.
Report — Project-level
Section titled “Report — Project-level”There are two report families, and both do the same jobs:
- Report — a structured report defined by rows, columns and groupings
- HTML Report — a report whose page you write yourself, with a script feeding its datasource
Both can be scheduled, emailed and written to a file. The output formats are HTML and PDF; the PDF is printed by a headless browser on the server. Reports have no Excel output — use the export paths to get table data into Excel.
Expression (shared formula) — Space-level
Section titled “Expression (shared formula) — Space-level”Shared compute formulas used by many variables or alarms. Centralizes repeated formulas so they can be maintained in one place.
Project Map
Section titled “Project Map”A GIS view with project locations. Each project marker shows live values, alarm status, and connection health in a popup.
Database Layers
Section titled “Database Layers”inSCADA uses three data tiers, each tuned for a different data shape:
Relational database — configuration
Section titled “Relational database — configuration”Project definitions, variable settings, users, roles, alarm definitions, script code — all platform configuration data lives here. This data changes rarely, is relational, and prioritizes consistency.
Schema migrations are versioned and applied on start; the default schema name is inscada.
Time series database — history
Section titled “Time series database — history”Variable history, alarm history, event logs, login attempts — everything with a timestamp lives here. This data is write-heavy, rarely updated, and queried by time range.
Each measurement (variable value, alarm, event log) can have its own retention policy; retention durations are configured at the time series layer — inSCADA does not hard-code a default.
In-memory cache — live values
Section titled “In-memory cache — live values”The latest value of every variable is held in the in-memory cache. ins.getVariableValue() and the REST API read from the cache — they do not touch the history.
Benefits:
- Sub-millisecond live-value reads
- Thousands of variables can be read concurrently
- Web UI and scripts see the same current value
The cache also backs script global objects, session tokens, and rate-limit counters.
Data Flow
Section titled “Data Flow”From field device to web screen:
- Field device — PLC, RTU, sensor, meter, etc.
- Connection — attaches to the device using the configured protocol
- Frame read — the address block is polled at the frame period
- Raw value — the data returned by the device
- Scaling — raw → engineering conversion (if configured)
- Cache — the current value is written to the in-memory cache
- Logging — based on the logging type, a history point is written
- Alarm checks — alarm definitions are evaluated
- Consumption — Web UI (WebSocket/SSE), Script Engine, and REST API all read from the same cache
Write Flow (command dispatch)
Section titled “Write Flow (command dispatch)”UI / Script / API → cache update → Connection → protocol write → Field deviceWhen ins.setVariableValue() (or the UI) writes a value, the command is forwarded over the connection to the field device.
Multi-Space (Multi-Tenant)
Section titled “Multi-Space (Multi-Tenant)”Each space:
- Has its own set of projects
- Has its own user permissions
- Is data-isolated from other spaces
Users can have access to multiple spaces and switch between them mid-session. REST calls pass the target space via the X-Space header.
Cluster Mode (optional)
Section titled “Cluster Mode (optional)”By default inSCADA runs as a single node: that node is the permanent leader and none of the machinery below is in play. Multiple nodes are turned on with one setting:
ins.cluster.enabled=true # in the environment: INS_CLUSTER_ENABLEDWith it on, the nodes run as one leader and one or more followers. Leadership is held through a lease taken over the cluster membership layer; record replication, history sync and file replication flow from the leader to the followers over a message queue. The replication lag can be monitored.
Access and Ports
Section titled “Access and Ports”Default configuration:
| Port | Use |
|---|---|
| 8082 | HTTPS — Web UI and REST API (main endpoint) |
| 8083 | HTTPS — Sandbox (isolated origin for custom-HTML widget iframes) |
The application serves over HTTPS only by default; the TLS bundle is configured via server.ssl.bundle. No plain-HTTP port is opened by default.
The web UI works in any modern browser, including tablets and phones (responsive). No desktop client install required.
Configuration details: Configuration →